Introduction
Administration
Vendors & Partners
Purchase Order Views
Submitting an Invoice
Construct Schedule
Task Notes for Vendors
Payments/Remittance Advice
Vendor Export POS
Project Management
Purchasing and Estimating
Invoicing
Items
Introduction To Items
Navigating Items
When to Create a New Item
Unit of Measure
PO - BoM on Purchase Orders
Cost Model - Budgets
Bulk Item Creation and Modification Tools
Items FAQ
Attributes
Item Costing & Primary Vendors
Classification Codes
Creating Styles/Pallets/Storyboards
Jobs/Projects
Non-Job Purchase Orders
Construct
Introduction To Construct
Apply a Schedule - Prepare
Manage Construction Templates
Construction Dashboard
Delay Notes
Undo Task
Plan - Assign Start Date
Subtasks and Worksets
Task Notes
Sales
Sales Document Configuration
Sales Model Template Configuration
Sales Regions
Update Upgrade/Option Pricing
Docs
Introduction to Docs
Uploading a Document
Configuring Categories and Types
Bulk Permission Assignment
Reporting
Warranty
Introduction to Warranty
Accessing and Navigating the Warranty Module
Dashboards
Reviewing and Triaging Warranty Requests
Creating Warranty Requests
Find and Manage Warranty Jobs
Managing Warranty Requests
Managing Deficiencies and Work Orders
Closing Warranty Requests
Accounting
- All Categories
- Warranty
- Dashboards
Dashboards

Dashboards provide a summary of warranty activity and help users identify work that needs attention.
Manager Dashboard
The Manager Dashboard shows warranty workload across coordinators. It includes a coordinator filter, display for emails pending, and ticket sections for New, Open, and On Hold requests.
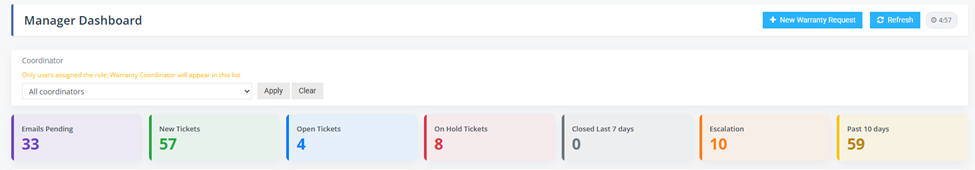
- Review inbound emails awaiting action using Emails Pending.
- Open filtered queues from summary tiles, such as New Tickets, Open Tickets, On Hold Tickets, Escalated Tickets, or tickets past 10 days.
- Filter by coordinator to review workload for a specific Warranty Coordinator.
- Create a new request for items received outside of email using New Warranty Request.
- Access Warranty Request details from filtered lists to add deficiencies or create work order.
Coordinator Dashboard
The Coordinator Dashboard is unique to the signed-in user. It focuses on that coordinators assigned workload, including pending emails, new tickets, open tickets, and on-hold tickets.
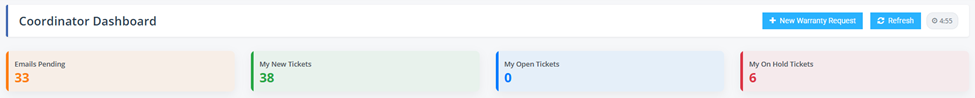
- Review inbound emails awaiting action in Emails Pending.
- Focus on assigned work with My New Tickets, My Open Tickets, and My On Hold Tickets.
- Create new warranty requests for items received outside of email using New Warranty Request.